Abstract
This article relies on maps created by students in Google Maps as they explored their literacy sponsors, in an effort to question and explore the future of the traditional literacy narrative. By focusing on the “trade routes” of their literacy acquisition, the students produced digital maps that problematized the linear narrative of progress inherent in many literacy narratives. Excerpts from students’ maps illustrate the temporal and spatial relationships underlying literacy sponsorship.
Keywords: mapping; literacy narrative; literacy sponsors; digital composing
Contents
The When and Where of Students' Literacy Narratives
Introduction
Mapping not only represents reality, but also has an active role in the social construction of that reality. (Dodge 115)
Is the literacy narrative dead? (Bryant)
Maps, mapping, and being mapped have become commonplace in many of our, and our students’, lives. We experience new and everyday places through digital maps that change as we move, both on foot and in vehicles. Wireless networks and mobile communication devices ensure that we can map and be mapped virtually anywhere and anytime. In turn, such maps of evolving time and place may prove useful as we engage students in digital and networked literacies and as we ask them to consider their roles in the creation and consumption of these maps. This article relies on such ubiquitous mapping as a response to the question “Is the literacy narrative dead?” The question was posed in a recent thread on the writing program administrator email list (Bryant) and resulted in over forty replies defending, questioning, and revising the commonplace literacy narrative. While some of the debate surrounded the usefulness of the literacy narrative genre, the most interesting contributions shared innovative approaches to the literacy narrative, including the use of music, video, and social media. As Jeffrey Grabill wrote in a recent blog post for Edutopia, “It is often said that technologies don't get interesting until they become culturally meaningful. I think this is the case with the technologies of digital writing.” My recent first-year writing class invoked this idea in its focus on literacy issues. I attempted to reinvigorate and reinvent the literacy narrative by focusing on a “cultural meaningful” technology, but a technology removed from much discussion of writing, including literacy narratives, digital or not—Google Maps. In this class, I not only introduced a variation on digital writing but also revised the traditional literacy narrative—a ubiquitous genre in much of first-year composition that also finds some ringing its death knell. Ultimately, my goal was to move beyond using an application such as Google Maps just because it is cool, or just because “we can” (Darlin), with hopes of complicating students’ linear understandings of literacy acquisition and literacy sponsorship. Specifically, I aimed to begin problematizing static views of literacy and literacy acquisition by locating literacy geographically and temporally (Trainor). In what follows, I outline this attempt, while also reflecting on the digital writing that a group of students produced in the form of maps.
Most discussions or pedagogical activities involving literacy narratives rely on the work of Deborah Brandt, particularly her concept of “literacy sponsors.” My students (all first- or second-year students in a general education writing course) had read and discussed Brandt’s concept of literacy sponsorship1 before embarking on the literacy mapping project. They were introduced to literacy sponsors as “any agents, local or distant, concrete or abstract, who enable, support, teach, or model, as well as recruit, regulate, suppress, or withhold literacy—and gain advantage by it in some way” (166). In Brandt’s use of the concept, sponsors hold the power, as they “set the terms for access to literacy and wield powerful incentives for compliance and loyalty” (167). Yet students were troubled by just how true Brandt’s acknowledgement of the “reciprocal relationship” sponsors engage in with those they “underwrite” might be in their own lives, especially as they engaged in literacy not of their own choosing. Such a discovery would, I hoped, lead students to reflect on Brandt’s “economies of literacy” and how such relationships are bound in particular realities of time and place, including economic, social, material, and ideological.
Moreover, and most important for my purposes in this article, Brandt reminds us that sponsors control the “trade routes” of literacies in a community, trade routes (and literacies) that can differ and shift based on time and place. Specifically, I hoped to spatialize sponsorship in maps by developing a visualization of the “trade routes” students encountered in their literacy acquisition. These trade routes highlight where the personal relationship between sponsor and sponsored interacts with the context of communities, institutions, and economies. Within these trade routes, many students discovered and shared moments of intervention, where the reciprocity of sponsorship allowed for intervention and agency by the sponsored. Additionally, students could see how their trade routes were similar to classmates’ trade routes; this similarity allowed us as a class to visualize somewhat abstract concepts, especially for first- and second-year students. Ultimately, the temporal and spatial must be considered to “see” these trade routes and their overlap (or disconnect). Mapping of literacy sponsorship allows such consideration and intervention on the part of students, and it complicates the linear narrative of progress found in and encouraged by many iterations of the traditional literacy narrative writing prompt (see Pandey).
And so I begin with a map, with one marker on a student’s Google map focusing on significant literacy sponsors and, in turn, trade routes. Lisa’s map (see Figure 1) provided the class with a visual, graphical, and mobile influence on the “where” of literacy development. She includes locations found on other student maps, including libraries and schools, but she also admits to collecting brochures, maps, and “informational packets.” Lisa includes Logan International Airport on her map, noting that her family frequently traveled in and out of the airport, leading to her interest in “different style[s] of writing.” Reflecting on her map creation, Lisa writes,
Most of these places were where I learned to read and write, but many of them are places that helped my passion for reading grow and expand. Many of the places are linked to people who helped me learn, such as my family at my house and my teachers at school. I was surprised at some of the places that I remember, those that were not required in the development of my reading and writing skills.
Not only does this brief glance into Lisa’s map of literacy sponsorship highlight relationships, but it also highlights the range of people and institutions influencing Lisa’s literacy sponsorship at that time and in those places, both, in her words, required and not required. Such a range is tied directly to the when and the where of those locations in Lisa’s life, as well as her movement (routes) among various people, institutions, and infrastructures.
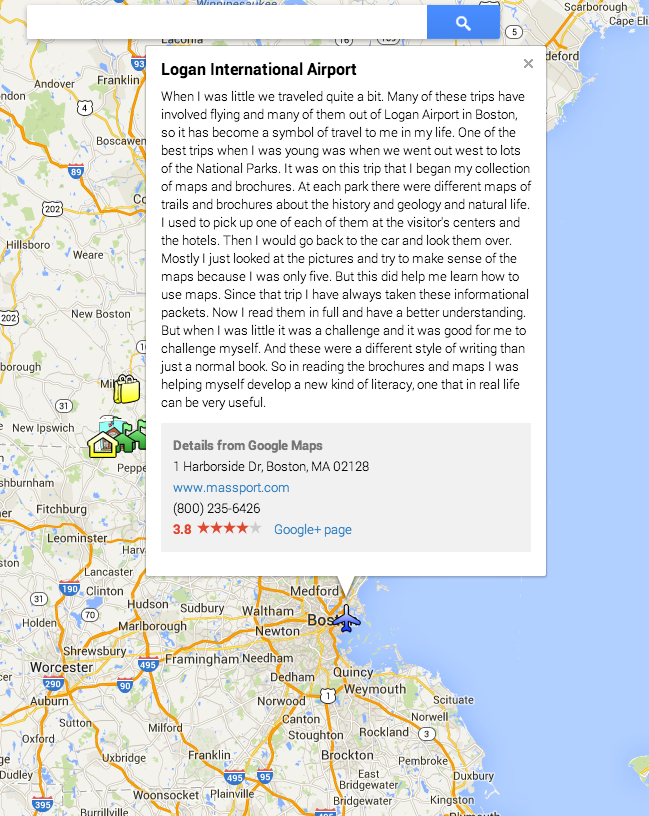 Figure 1: Exerpt of Lisa's Map, focusing on Logan International Airport
As I continue beyond Lisa’s map in this essay, I investigate the “why” of a particular type of Web 2.0 technology, Google Maps, and a particular genre, the literacy narrative. Such literacy mapping foregrounds the temporal and spatial; in turn, we can see the trade routes of these students’ literacy acquisition, creating potential impact both in the writing classroom and in how our students make meaning of their experiences, how mapping constructs that remembered reality (Dodge). I focus on how such mapping technology (or information visualization applications) influences how we approach narrative, especially the linearity of the literacy narrative, as well as the spatial component of literacy. Moreover, taking such a tack with students introduces and complicates the relationship between literacy and place, resulting in “narratives” that situate disparate literacy sponsors such as the cinema, boarding schools, and grandparents in spatial and temporal proximity to each other. Such a project allowed students not only to read about literacy sponsorship but also to begin unpacking the reciprocal relationships inherent in such sponsorship, with some attention to the “when” and the “where” of literacy infrastructures. For the literacy narrative to avoid death, it may need more than a revision. It may need a replacement of the linear narrative structure such a genre finds itself stuck in—an update of both the genre and the key concept, literacy sponsorship. Furthermore, and as will be detailed below, such a pedagogical revision follows the trajectory in writing studies towards the digital and spatial.
This article, then, illustrates Madeline Sorapure’s claim that mapping applications, along with other information visualization applications, “enable us and our students to make the move from consuming to producing visual representations of information" (60). In such a move, one that echoes Martin Dodge’s depiction of mapping as an active construction of reality, we offer an approach to the composing process, and to our understanding of the “when” and the “where” of literacy development, that focuses more attention on the materiality of our “narratives.” Through exploring the “why” of using Google maps, I push students to begin exploring the “when” and “where” of literacy sponsorship (after all, you can only make so much progress in one semester). Such digital composing and mapping not only begins to complicate students’ understandings of literacy but also highlights why digital writing matters (and perhaps, why the literacy narrative may still matter).
The Course
The map from Lisa emerged from a general education writing and letters course focused on literacy, specifically the history of literacy in our northeast state, and was titled “From Slater to Slate: The Rise of Literacy in [New England State].” The course enrolled first- and second-year students fulfilling a general education requirement. A portion of the course description reads:
Locally, debates surrounding literacy education involving immigration, technology, and employment are not new, especially in the state of [?]. Due to its history, size, and current economic troubles, [the state] provides a unique perspective on the relationship between literacy education and industrial and economic change. This course will introduce students to the history of literacy education in [the state], including the impact of the industrial revolution on literacy education. Students will read a variety of documents and texts including biographies, essays, scholarly articles, newspaper stories, personal writings, and testing materials. These texts will allow students to gain perspective on and grapple with issues such as child labor, public education, mill communities, the rise of Sunday schools, and the legacies of such industrial change in the state today. Ultimately, students will rely on the historical readings to engage with today's economic change and literacy education.
For readings, I paired local documents, histories, and primary materials with readings from Literacy: A Critical Sourcebook. Throughout the semester, the students completed four projects designed to reflect, illustrate, complicate, and extend the readings on literacy: a literacy mapping project, an archival document analysis, a museum exhibit proposal, and a group presentation focused on literacy centers. Such an approach to the course, and to the individual project on mapping literacy sponsorships, emerges from the field’s growing interest in the spaces and places of literate activities, as well as digital writing technologies. Students were encouraged to analyze and produce literacy-related artifacts, introducing a temporal and geographic approach to the study of literacy. For example, the final project focused on literacy centers required demographic and economic analysis of a specific community to understand the context within which literacy centers operate.
Mapping and Composing
The geographical, and therefore spatial, turn in Composition Studies can be largely attributed to Nedra Reynolds’s work on the places of student composing, both physical and metaphorical. Reynolds writes that “[g]eography gives us the metaphorical and methodological tools to change our ways of imagining writing through both movement and dwelling—to see writing as a set of spatial practices informed by everyday negotiations of space” (Geographies 6). Ultimately, Reynolds pushes us to see the materiality of writing and, in turn, literacy. Her push for a “geographic emphasis” asks the field to “link the material conditions to the activities of particular spaces, whether those be campuses, classrooms, office, computer labs, distance learning sites, or hotels” (“Composition’s” 30).
In many ways, this linking echoes Harvey Graff’s explorations of literacy development in specific cities and regions of the nineteenth century, noting the ways in which literacy levels reflect material conditions. However, Reynolds’s and Graff’s work also supports an infrastructural approach to analyzing composing and literacy sponsorship in general. Danielle DeVoss, Ellen Cushman, and Jeffrey Grabill rely on an infrastructural framework to understand new media composing in education settings. For my purposes, the infrastructural framework helps unpack the “why” by connecting the “when” with the “where” in my pedagogical approach to introducing literacy sponsorship in the classroom and, in particular, in this Google mapping project. In short, the “when” is key to literacy sponsorship, and the infrastructural framework highlights that literacy sponsorship “is more than material, is never static, and is always emerging” (Devoss, Cushman, and Grabill 22). My goal was to use mapping as a means to unpack and spatialize literacy sponsorship, while also uncovering the reciprocal relationships underlying sponsorship. In that sense, I was also pushing beyond the when to connect it with the where, since our literacy sponsorship maps include time and place.
Introducing literacy sponsorship—the reciprocal relationship between sponsors and sponsored in terms of support, access, and regulation to literacy—through Google maps illustrates the key concepts behind an infrastructural framework, concepts that, while not introduced to students, provide language to discuss how such a mapping activity exposes the complicated nature of the “where,” as well as the “when,” in our literacy sponsorships (Devoss, Cushman, and Grabill 20-21). Moreover, such concepts provide elements of how we understand the “trade routes” apparent in literacy sponsorship. As Devoss, Cushman, and Grabill describe, the characteristics of infrastructure are as follows:
- Embeddedness. Infrastructure is "sunk" into, inside of, other structures, social arrangements and technologies.
- Transparency. Infrastructure is transparent to use, in the sense that it does not have to be reinvented each time or assembled for each task, but it invisibly supports those tasks.
- Reach or scope. This may be either spatial or temporal—infrastructure has reach beyond a single event or one-site practice.
- Learned as part of membership. The taken-for-grantedness of artifacts and organizational arrangements is a sine qua non of membership in a community of practice [...]. Strangers and outsiders encounter infrastructure as a target object to be learned about. New participants acquire a naturalized familiarity with its objects as they become members.
- Links with conventions of practice. Infrastructure both shapes and is shaped by the conventions of a community of practice.
- Embodiment of standards. Modified by scope and often by conflicting conventions, infrastructure takes on transparency by plugging into other infrastructures and tools in a standardized fashion.
- Built on an installed base. Infrastructure does not grow de novo; it wrestles with the "inertia of the installed base" and inherits strengths and limitations from that base.
- Becomes visible upon breakdown. The normally invisible quality of working infrastructure becomes visible when it breaks. (20-21)
Relying on such terminology, we can compare very different maps through a similar analytical lens. An infrastructural approach also offers language to describe, investigate, and expose the complicated networks involved in each student’s literacy sponsorship map. Essentially, we can understand such literacy maps as connecting the “where” to the “when” of DeVoss, Cushman, and Grabill’s infrastructural approach. Literacy narratives, representing a select and personal timeline, progress through different literacy infrastructures, reflecting select and personal locations. In short, the language of infrastructure can allow a lens through which to understand the trade routes found on students’ maps.
Of late, scholars find the where of composing and the materiality of literacy complicated by the abundance of, and enthusiasm for, digital writing technologies—as such, the digital and geographical turns have intertwined. This merging, or “changed environment,” has led some to call for a revised approach to teaching digital writing (Grabill; WIDE). Subsequently, some have positioned student writers as more akin to cartographers. Christopher Schmidt writes that “new writing technologies will continue to change not only the place of writing but also the writing of place, allowing students to represent the environment and the world with unprecedented fidelity” (303). This visual representation of information and its effects on students and writing gains further attention from Sorapure’s work on information visualization applications. Pushing for teachers to incorporate information visualization applications into their writing classes, Sorapure writes, “as students interact with these programs and find, organize, analyze, and visualize data, they are exercising rhetorical and technical skills that are increasingly relevant in this information age” (69). The applications and activities Sorapure asks her students to accomplish, including text, personal, and social visualizations, “provide yet another way of thinking about the role of the visual as it stimulates, accompanies, critiques, supplements, and/or replaces writing” (60). They also provide another way for students to investigate the relationships identified in specific literacy sponsor relationships.
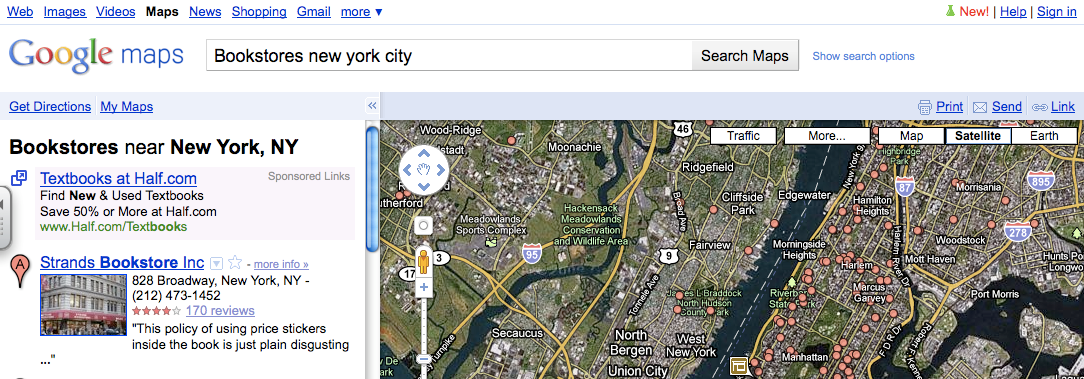
In order to introduce the materiality of literacy, Schmidt relies on maps and Web 2.0 mapping applications such as Google Maps to “help students think about how the digitalization of new media fundamentally restructures the ‘place’ of rhetoric” (313).2 Encouraging students to consider the “political and economic motives of those who ‘write’ the map,” Schmidt contends that Web 2.0 mapping applications allow students insight into “a form of multimodal spatial writing that has already been subject to centuries of development and study” (313). Perhaps Web 2.0 applications, such as Google Maps, have gained their most substantive implementation in the classroom in Dale Jacobs, Hollie Adams, and Janine Morris’s pedagogy, captured in “Writing New York: Using Google Maps as a Platform for Electronic Portfolios.” Jacobs, Adams, and Morris exposed students to the rhetorical nature of maps, hoping they would come “to recognize that in producing a map they are essentially creating a subjective notion of space rather than reproducing an objective reality” (115). In short, the authors saw Google Maps as way to combine “screen culture and street culture” (116). And so, they asked students to create pre- and post-maps using Google Maps surrounding a field trip to New York City. The post-map functioned as a portfolio, allowing students to capture their encounters with the city—essentially using Google Maps as a writing platform. Ultimately, we see writing instructors, and the field as a whole, implementing and reflecting the geographic and digital shifts as a way for students to make meaning of their places in the world or, to make meaning of the where and when in those reciprocal relationships underlying literacy sponsorship. Even Jacobs, Adams, and Morris’s course design, while clearly focused on the place of New York City, reflected a temporal concern, allowing students to reflect on when they experienced New York City.
Literacy narratives have become a widely-accepted genre for students and teachers to explore and reflect on their literacy sponsorship stories. In our first year writing program, the literacy narrative is one of the required genres of first-year writing courses (and I assume we are not alone). The field has invested heavily in the potential for such an exploration, in which students tell the story of their literacy, even digital literacy, development. It is safe to claim that the assignment/genre has been canonized in most composition textbooks, even in recent books reflecting the digital turn in composition (Wysocki, Johnson-Eilola, Selfe, and Sirc). Yet as noted in the introduction, the death of literacy narrative has been predicted, prompting discussion pointing to its demise, eventual demise, or metamorphosis. Beyond first-year students, many of us in the field also investigate and collect literacy narratives as a means for uncovering how our stories, as well as the stories of others, reflect our similarities and differences, witnessed in Cynthia Selfe and Gail Hawisher’s Literate Lives in the Digital Age and Brandt’s Literacy in American Lives. During the early stages of this mapping project, I also ask students to consider their (traditional) literacy narratives—narratives of progress, of trade routes that move forward in similar fashion. Ultimately, we read Brandt’s “Sponsors of Literacy,” as well as work from Graff, to complicate the linearity found in many student literacy narratives. Such work does begin to situate these literacy trade routes within specific times and places. By shifting the literacy narrative to an investigation of specific times, places, and relationships, I ask students to produce narratives that are related spatially and temporally rather than through a linear progression or hierarchy (see Appendix A). In turn, I also seek to avoid the reflective triumph of writers, as they retell their journey to literacy enlightenment.
As Iswari Pandey notes, “[l]iteracy narratives, whether print or electronic, usually end on a linear, progressive note” (252). Pointing towards the potential for a disruption of such linearity, Schmidt indicates, “[A] spatial representation of argument rather than a linear argument … is a reflection of the mass cultural move from relying upon a codex information storage system, in which a linear argument is the dominant form of storage, toward forms of argument that reflect and exploit database-driven forms of writing” (305). Dodge, writing about maps as virtual research methods, maintains, “[c]heap, powerful computer graphics on desktop personal computers (PCs) enables much more expressive and interactive digital cartography” (114). Like Schmidt, my goal in this project is to complicate literacy development and concepts such as literacy sponsorship by “emphasizing the spatial aspects of writing rather than the chronological aspects of writing” (313); in other words, to echo Dodge, allowing literacy narratives to be more interactive, or differently interactive. Working through these maps, the students and I document the relationships, of people, time, and place, supporting and regulating literacy sponsorship. To be clear, I am not avoiding narrative—students are telling their stories, for sure. However, by focusing on the when and where of literacy sponsorship, I intended to illustrate, for example, that “the politics of place undercut the prevailing myths about the computer and the Internet as neutral and world-wide medium” (Pandey 252). I wanted students to realize, or begin to consider, that literacy sponsorship is a complicated network—trade routes—of various elements, including technologies, resources, people, and institutions. While Jacobs, Adams, and Morris see the potential for students using Google Maps to imagine and reflect on their experiences with a city, such as New York City, this project asks students to begin reflecting on the when and where of their, and their classmates’, literacy development. In other words, students can produce and share their stories, their writing, through a medium other than what they might expect in a first-year writing course. Ultimately, this approach also personalizes those reciprocal relationships undergirding the concept of literacy sponsorship; the infrastructures of “any agents, local or distant, concrete or abstract, who enable, support, teach, model, as well as recruit, regulate, suppress, or withhold literacy—and gain advantage by it in some way” (Brandt 166). By focusing on the when and where of sponsorship, students recall neighborhoods, after-school programs, former houses, and deceased relatives, introducing both the when and the where of key moments in literacy acquisition. Echoing Jacobs, Adams, and Morris, the project, I hoped, “would better prompt students to consider how the place they visited or the event they took part in was necessarily tied to its spatial context—to the cultural, political, or economic fabric of its surrounding neighborhood" (116). In other words, students would visualize the complicated infrastructures underlying one’s literacy development, whether digital or print, and how literacy infrastructures capture a particular time and place, as well as movement, or trade route, through that time and place that is bigger than themselves.
The When and Where of Students' Literacy Narratives
In this section, I share some sample student maps, as well as the students’ reflections on their maps. Obviously, the examples are not a complete representation of student work; it would prove impossible to capture all students’ maps.3 Nonetheless, my goal is to begin a discussion of digital writing and literacy sponsorship through such examples, to introduce how such an assignment can begin a conversation on the when and where of literacy sponsorship. To reiterate, students used Google Maps, particularly the My Maps function, to create public maps of their literacy sponsors (for more on the “how to” of Google Maps see Jacobs, Adams, and Morris). We shared these as a class, and in some cases, I created a layered map of various student maps so the class could get the “big picture” of our collective map. Students tended to immediately name and locate the obvious sponsors: elementary schools, libraries, teachers, and family members appeared quickly on maps. However, some included less obvious places—or places more unique to their location and network. For example, one student wrote, "I learned that many literacy sponsors are located around the community where children are brought up . . . My town obviously had many resources for early literacy which makes me extremely lucky." He continues,
Bow Tie Cinema is the movie theater in my hometown. It may be weird that a movie theater supported my literacy; however, they really got me into reading when I was 8 years old. In the third grade Bow Tie had a ‘reading challenge’ where we could get free movie passes if we read 5 books a month. It would be so exciting for me and my elementary school buddies to earn free movie passes at the end of every month and I did a lot more reading because of it.
What also “appear” in these maps are the missing, or not yet developed, places of literacy sponsorship. Years from now, it may prove impossible to do such mapping without regular appearances of Starbucks and other coffee shops, as well as mobile devices, including laptops and iPads. But, again, there is a when that is central to the where of these maps.
June’s Map
Included in June’s map are locations such as Borders bookstore, her elementary school, her mom, and Sesame Street. Also noticeable on June’s map is the location of a swim and tennis club (see Fig. 2). Writing about the club, June admits, “The fact my camp was even pushing literacy and reading seemed crazy to me at the time, but now I realize why. The directors of my camp obviously realized that literacy was so important that it should not only be a part of school, but also camp during the summer.” More importantly, June concedes that the mapping activity highlighted for her the profound role her mom played in creating the where of June’s literacy development: “A lot of my sponsors connect back to my mom being so involved in my life, which makes me realize the most important part of my education was my family. My family gave me the opportunities to even get these sponsors and I really owe it to them to bring me to these places that take literacy education very seriously.” June highlights the important role that membership, whether in a family or organization, plays in one’s literacy development. In fact, membership gains priority over a concept such as resources in June’s map.
In addition, June’s map offers insight into how those locations, and in some cases institutions such as school, bookstore, and tennis and swim club, reflect both a place and a time. She admits that the club is now closed, and one assumes the Borders store is closed, highlighting a shift from bookstores to online book retailers such as Amazon. Beyond zooming into one place on her map, June also situates her map, or her literacy sponsorships, within various institutional and infrastructural moments and places. For example, we could zoom out to an overview of the northeast United States, the city of Stamford, or the state of Connecticut. We could look at the infrastructure of her public school district, including data such as test scores, free and reduced lunches, or per student spending. In addition, we could look at the role of summer camps and private swim and tennis clubs within the lives of school-aged children;we could even map these clubs in Stamford with other institutions such as daycares, YMCAs, and other summer camps. In this course, we do spend some time with socioeconomic, census, and education data as a means of examining how literacy might fit into those statistics, trends, and maps. Students are encouraged to consider the layers we might place on such maps in order to complicate the current view.
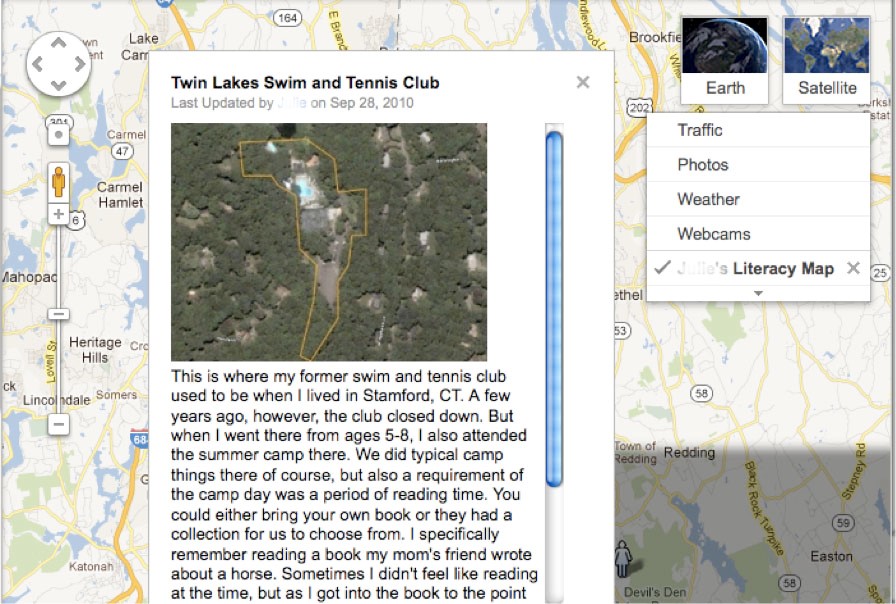 Figure 2: Excerpt of June’s Map with Swim and Tennis Club
Mallory’s Map
Like many of her peers, Mallory’s map includes traditional educational institutions, such as elementary school and high school, but it also highlights other people and places unique to Mallory and the when and where of her literacy development. For example, she includes the Jewish Community Center, her grandparents’ residence in Florida, and a ballet studio. In addition, she acknowledges the role a high school internship played in her literacy development (see Fig. 3). Ultimately, Mallory’s map highlights the urban nature of her youth, or her “journeys and adventures,” as she puts it. As the only Catholic student in a Jewish classroom, she states, “I learned a lot here too, especially how to interact with an entirely different ethnic group.” This map, according to Mallory, illustrates that “the schools you attend, the clubs you join, the activities you engage in, [and] the projects you pursue all boost your literacy abilities in life.” Beyond exposing the role membership plays in her literacy map, Mallory also points to the varying conventions of practice present in each of these different settings. She contrasts the learning done in ballet, which included both physical learning, as well as an understanding of ballet terms and jargon, with that of her internship. She mediates the activities of volunteers through the composing and sharing of instructions, connecting both online and face-to-face communication.
In addition, the reach and scope of Mallory’s map bridges geographic distance and generations. While raised in an urban environment, Mallory was not bound to such an environment. Through internships, an exposure to Jewish classmates, and travel to Florida, Mallory presents a varied and diverse map highlighting generational and geographical networks. Such reach and scope, both temporally and spatially, is visualized in such a map, a visualization unavailable in a narrative re-telling of one’s literacy sponsorship. In other words, the linearity of literacy development, a progression through sponsors and events, is flattened. Instead, Mallory can look at her entire map, or zoom into one time and place on that map and in her life.
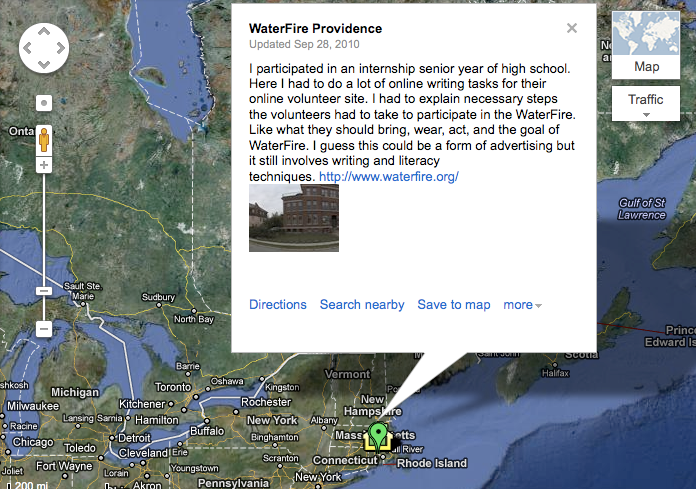 Figure 3: Excerpt of Mallory’s Map, including internship location
Lynn’s Map
Writing about the piano lessons her parents forced her to take, Lynn comments, “Whenever I was going through a rough time, I turned to the piano. Whether it was playing emotional songs, which were already composed, or trying to write my own songs, it was my escape from the world around me.” Lynn’s map also includes computer games, an aunt, and cheerleading. However, it is the piano lesson description where Lynn notes not just her parents’ influence on her literacy development, but how those piano lessons at Mrs. McGravey’s home broadened her understanding of music and composing (see Fig. 4). In this sense, the piano, or the playing of the piano photograph, captures a combination of human and non-human elements central to this place and time: piano, parents, piano teacher, piano teacher’s home, etc. But in her reflection, Lynn is also sure to point to the role of a desktop computer in her early literacy development as key. Such an object represents a culmination of people, places, and cultural shifts. Moreover, Lynn was one of the few students who located a computer on their maps. However, this example also points to the limits of Google Maps: students must choose one label and one image, or one tag, for the marker on the map. Google maps cannot capture the layered and nuanced (both local and global) forces, institutions, people, and objects underlying and promoting that marker on the map. In turn, we, viewers of the map, see a computer or a piano, relying on a brief narrative for context for a rather complicated trade route.
Ultimately, Lynn acknowledges that a diversity of literacy sponsors proves key to her, and others’, development, noting the surprising role “activities, people, places, and technology” all play in creating a place. This diversity of elements on Lynn’s map highlights the ways in which infrastructure may only become visible upon breakdown, even if such visualization is limited by the software application. A narrative approach may not facilitate seeing connections between desktop computers, cheerleading, and piano lessons, especially in the context of one’s literacy development, but mapping may also not allow for such networked viewing or sharing. To gain visibility, such disparate elements require not just the telling but also the placing in time and space—the placing, unplacing, and movement through literacy infrastructures.
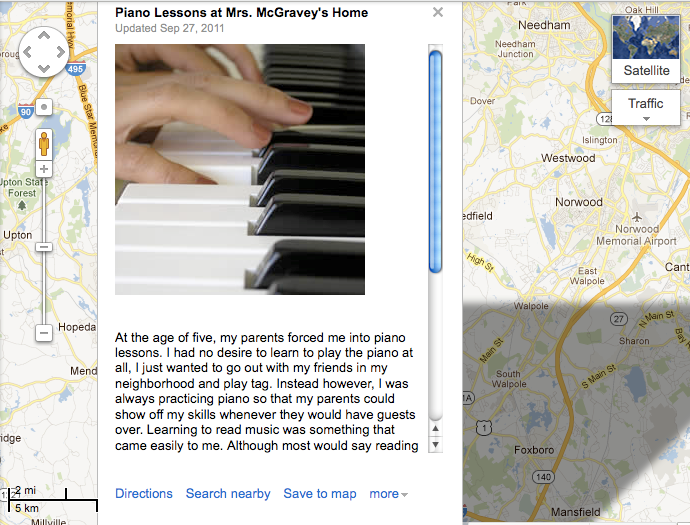 Figure 4: Excerpt of Lynn’s Map and Piano Lessons
Angie’s Map
Finally, I offer Angie’s map. Angie was quick to admit in class that her map looked different than others, since she was raised in an inner city. While many of Angie’s locations look similar to the locations of other students’ maps in the class, Angie’s map does highlight the ways in which educational policy is influencing the role of place on literacy development and sponsorship. In turn, Angie’s map asked the class to reconsider the place-based data we had looked at earlier in the course, data such as test scores, per student spending, and census data. The answer, as Angie’s map indicates, can be as functional as moving students out of their place, at least for the school day. As an inner city resident, within a district housing an underperforming high school, Angie was selected to participate in a program that bussed her out to a higher performing suburban high school (see Fig. 5). In her reflection on the map, Angie notes, “seeing these areas highlighted has opened to my eyes all the opportunities that have been handed to me.” Clearly, she sees programs, such as the METCO program, that bus students to higher performing schools, as “opportunities”—and an opportunity she was lucky to receive. Angie was adamant that she did not see the where of her literacy development as a weakness but rather as a strength and opportunity. In a fairly homogenous class, Angie was outspoken about how different (she assumed) her experience was from her classmates’ experiences. However, in the telling of her story through her map, Angie also complicated the class discussions of literacy sponsorship and the role of power and regulation in sponsor relationships.
Her map reflects the overlapping and at times contradictory relationships found within one student’s map. To attach a linear, progressive narrative arc to Angie’s literacy narrative would overlook how place both limited and empowered her literacy development. But her map also highlights the importance of connecting the when and the where of literacy sponsorship. Educational policies change and the educational infrastructures change through time and place. In this way, Angie’s map is emblematic of the overall aim of this project, while also reflective of the difficulties in trying to tell literacy sponsorship stories. Such projects open up discussion, or introduce discussions, on the complicated and changing networks of literacy sponsorship. Maps and narratives, representing the same student’s journey, can look drastically different and can open up larger discussions of national and local education policies. Zooming out, Angie’s entire map shows locations but also a route—a route from her home to school, highlighting a particular route for her literacy education (Figure 6 captures a more complete map). In addition, she includes a location for the Massachusetts Department of Elementary and Secondary Education. Moreover, Angie and Mallory, both self-described inner city and urban residents, created maps that do not neatly sync with each other on the whole. As those literacy infrastructures change and develop over time and place, we see various reflections on how such infrastructures were changed, negotiated, and impacted by these students.
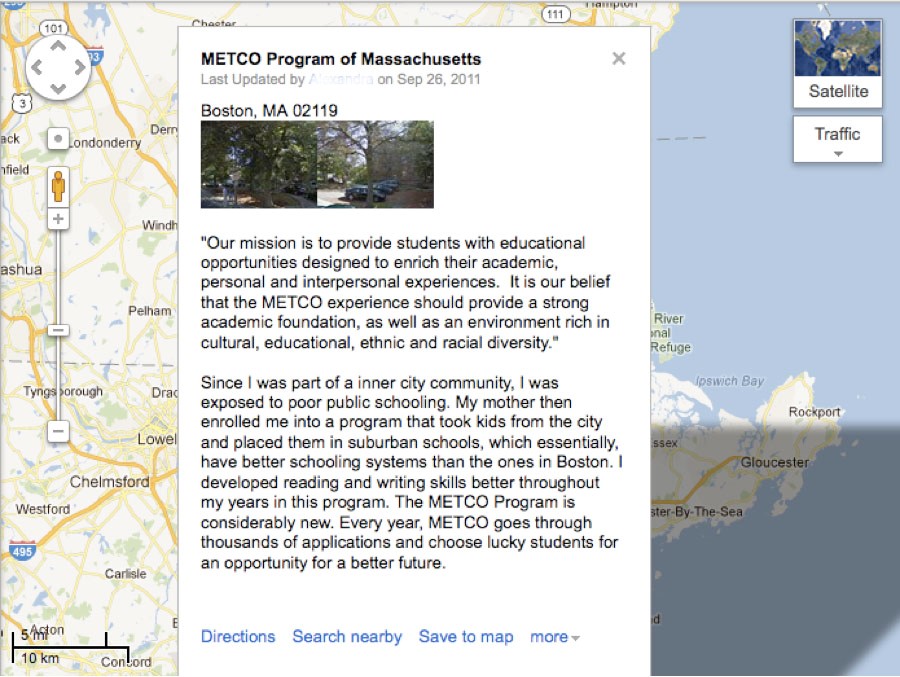 Figure 5: Excerpt of Angie’s Map, highlighting the METCO Program
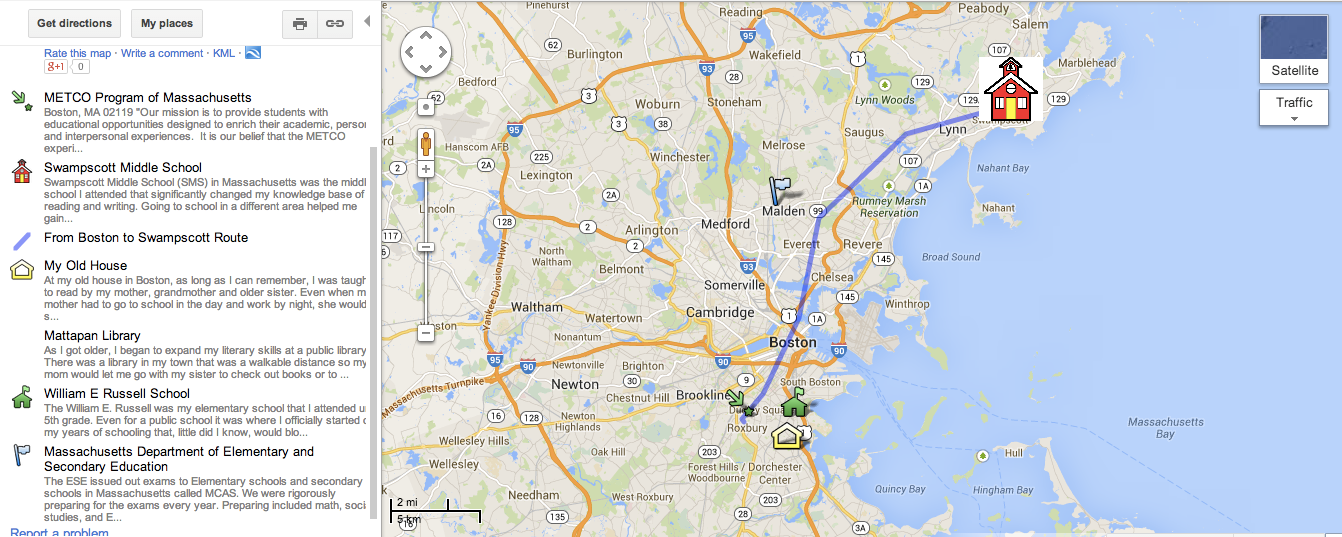 Figure 6: Angie’s complete map
Conclusion
Like Jacobs, Adams, and Morris, I hoped students would create spatial, as well as temporal, meanings from this mapping activity. Too often, the literacy narrative project ends at a chronological analysis—either one significant event is analyzed and reflected upon, or a chronology of development is retold through the eyes of the more mature, college student. However, we should push students “to think more about the ways in which they create meaning from the spaces around them” (Jacobs, Adams, and Morris 123). By telling the “spatial stories” of their literacy development through selected literacy sponsors, students are creating meaning; they are (re)creating their worlds and their “trade routes.” As Jeff Rice notes, students create the database that is their map, represented in what they choose to locate; “each item can be drawn on to make meaning” (“Urban” 211). In turn, this mapped network of literacy sponsorship is “a shifting identity based on the individual or individuals who construct it. It is a spatial knowledge made out of the communal relationships between the personal and the place” (214). More simply, as Rice writes, “Identity is not fixed; it is moving” (Digital 6).
Such moving complicates our understanding of infrastructure, as it relates to literacy sponsorship and reciprocity. The act of mapping one’s literacy sponsorship relies on developing an infrastructural framework, a framework that accounts for the when and the where of one’s literacy experiences. What we see in Angie’s map is not the inner city experience, but a snapshot of her literacy experience, and the disparate elements (human and non-human) that impact such a snapshot. Even a limited map allows viewers and writers to move beyond a one-way or two-way reciprocal relationship placed on a map. Rather, reciprocity is re-negotiated and re-mapped over time and place; in some ways, we see the beginnings of a networked reciprocity reflected in these maps and trade routes. As Dodge remarks, “[m]aps provide graphical ideation which renders a place, a phenomenon or a process visible” (115). Mapping supplements and complicates a traditional literacy narrative, unpacking literacy sponsorship, as well as narrative, while students produce digital writing. This approach is illustrated in a student’s final exam response pointing to how one might address literacy divides: “The city already addresses these situations with other programs but doesn’t take the time to think about the other pressing issues (such as gang violence and especially the ‘grandparents as parents’ issues) that contribute to the other vast issues that negatively impact the community as a whole and literacy development of each person residing in it.” This final exam response, as well as the project as a whole, recalls Reynolds’s concern that writers need to be more aware of, and account for, “their own locatedness” while also acknowledging “differences in people’s sociospatial worlds and their unequal access to modes of travel” (Geographies 133, 140). Lisa traveled throughout the country by car and airplane, while Angie traveled to the suburbs, and June traveled to a summer swim and tennis camp. For some students, this acknowledgement of traveling between literacy infrastructures involves traveling to uncomfortable or new places, such as Mallory’s experience journeying from Catholicism to Judaism, that, while within the same geographic region, feel farther away than foreign lands.
At the theoretical level, I hoped students’ analysis and production of maps would illustrate “trade routes,” since
traditional literacy or . . . digital literacy is deeply tied to economic forces and multiple contexts of culture, politics, and location. Understanding those forces and contexts is crucial to being able to appreciate individual literacy practices involving one or the other technologies of literacy. (Pandey 256)
Concepts such as the digital divide, underperforming schools, and economically-challenged neighborhoods are intertwined within each of our experiences and mapping, I contend, helps make those concepts real—the activity offers those concepts a where and a when. The infrastructure underlying our stories, including stories of literacy development, may at times be overlooked if we focus on progress narratives and if we position reciprocity as a dyadic relationship between sponsor and sponsored, removed from the trade routes of our lives. Instead, as Jennifer Trainor contends, we need to account for both the geographic and the temporal. When a student argued for a particular approach to a new literacy center in an economically-depressed part of the state based on child and adult literacy levels, location vis-à-vis needy residents, and services beyond those strictly–related to literacy, she was moving beyond her story and seeing her story in relationship to other stories and to other situations of sponsorship, to other infrastructures. Echoing these concerns, another student passionately argued for better attention to the hours of service for literacy centers, showing how closing times must match all residents’ needs and life situations. Students begin to see literacy beyond the academic acquiring of reading and writing, but rather as a complicated interplay of a place and a time.
At the pragmatic level, projects such as this echo Sorapure’s interest in information visualization applications:
[A]ssignments that draw on [information visualization] applications open up new possibilities for writing teachers to present the standard modes of analysis, personal writing, and argumentation in the context of data-driven inquiries. By incorporating these kinds of assignments, we can help prepare students to be savvy participants in the world of Web 2.0 as well as critically informed undergraduates and professionals. (68-69)
This is more than we typically ask of the literacy narrative genre and, perhaps, more than we ask of the typical first-year writing class. But, the infrastructural framework/s hiding behind all literacy narratives deserves more attention. As Grabill notes, this is part of showing why and how digital writing matters: “our challenge is to figure out how to be useful to those interested in leveraging these new writing platforms with thoughtfulness and power.” The geographic and digital turns in Composition Studies present new paths for us to embrace and travel with our students—especially if those paths lead to international airports, boarding schools, movie theaters, and grandparents’ houses. Much good can be found in the reflective personal writing of literacy narratives, and a quick glance through the WPA-L email responses to “Is the literacy narrative dead?” will find such positive reports. Yet, the initial query, spurred by a publishing representative’s comment on the passing of the literacy narrative genre, only reinforces our need to map the “trade routes” of our own field’s literacy genres, as well as our students.
Endnotes
1Throughout the article, pseudonyms have replaced students’ actual names. In addition, the figures included in the article are screenshots of their maps, preventing readers from accessing the specific maps.
2Essentially, Web 2.0 represents the advent of web applications relying on collaboration, sharing, and user-generated content. Within recent digital writing scholarship, Web 2.0 has received significant attention, especially as it applies to the teaching of writing. For examples of recent work examining Web 2.0, see Vie, Arola, Dilger, Purdy, Karper, and Portman-Daley.
3With a class of over twenty students, I could not include all student maps. My reflections on the mapping project in general encompass a concern for all of the maps. Moreover, I refer to other locations and maps beyond those included. I did not approach this course or assignment within a research project, complete with research questions and research methods. As a reflection on pedagogical practice, this article includes select maps available to me after the course’s completion.
Appendix A
Project 1: Google (Literacy) Map Assignment
Harvey Graff maintains that place of birth and place of residence are key aspects to understanding literacy levels. Essentially, where and when you were born play key roles in your literacy development. As we’ve discussed in class, children born today will have a much different exposure to literacy technologies than you may have experienced as a child. This project asks you to create a personal literacy map for a particular location in your life. Once you choose a location, you will then mark key places, people, etc. You will also create a written entry (up to 1200 words) for each marker; remember that you should provide context and detail for each entry. Additionally, you can include photographs and video as part of your map. You will also create an introduction for the map and the changes the map may reflect—or, what the places say about you and how they impacted your literacy development.
These maps will be completed with software such as Google Maps, allowing for sharing of maps as well as multimedia. We will spend time in class familiarizing ourselves with Google Maps. In the meantime, you can check Google Maps out at: http://maps.google.com/. There is also a video on how to use MyMaps here: http://maps.google.com/support/bin/answer.py?hl=en&answer=62843. The first step is ensuring you have a Google account—if not, we will create one in class.
I will be using the following criteria in assessing your project:
- Significance of locations: Is the significance of a particular location, place, person clear to viewers?
- Variety of locations: Does the map include a variety of locations, including places and people?
- Connection to literacy: Does the map reflect a connection to literacy development?
- Use of technology: Does the map utilize various aspects of Google Maps, such as linking, visuals, etc.?
- Introduction: Does the introduction present the map as a coherent whole? Does it explain what you are trying to do with this map?
Works Cited
Arola, Kristin L. “The Design of Web 2.0: The Rise of the Template, The Fall of Design.” Computers and Composition 27.1 (2010): 4-14. Print.
Brandt, Deborah. “Sponsors of Literacy.” College Composition and Communication 49.2 (1998): 165-85. Print.
Bryant, Liz. “Is the Literacy Narrative Dead?” Message to the WPA-L Listserv. 24 Jul. 2013. E-mail.
Cushman, Ellen, Eugene R. Kintgen, Barry M. Kroll, and Mike Rose, eds. Literacy: A Critical Sourcebook. New York: Bedford/St. Martin’s, 2001. Print.
Darlin, Damon. “A Journey to a Thousand Maps Begins With an Open Code.” New York Times 20 October 2005. Web. 27 February 2011.
Devoss, Danielle Nicole, Ellen Cushman and Jeffrey T. Grabill. “Infrastructure and Composing: The When of New-Media Writing.” College Composition and Communication 57.1 (2005): 14-44. Print.
Dilger, Bradley. “Beyond Star Flashes: The Elements of Web 2.0 Style.” Computers and Composition 27.1 (2010): 15-26. Print.
Dodge, Martin. “The Role of Maps in Virtual Research Methods.” Virtual Methods: Issues in Social Research on the Internet. Ed. Christine Hine. New York: Berg, 2005. 113-27. Print.
Grabill, Jeffrey. “Why Digital Writing Matters in Education.” Edutopia 11 June 2012. Web. 16 Jan. 2013.
Graff, Harvey J. “The Nineteenth Century Origins of our Times.” Cushman et al. 211-33. Print.
Jacobs, Dale, Hollie Adams, and Janine Morris. “Writing New York: Using Google Maps as a Platform for Electronic Portfolios.” Composition Studies 38.2 (2010): 111-29. Print.
Karper, Erin. “Web 2.0 and Literate Practices.” Computers and Composition Online (2009). Web. 7 Nov. 2009.
Pandey, Iswari P. “Literate Lives Across the Digital Divide.” Computers and Composition 23.2 (2006): 246-57. Print.
Portman-Daley, Joannah. "Reshaping Slacktivist Rhetoric: Social Networking for Social Change." Reflections: A Journal of Writing, Service-Learning, and Community Literacy 10.1 (2010): 104-33. Print.
Purdy, James P. “The Changing Space of Research: Web 2.0 and the Integration of Research and Writing Environments.” Computers and Composition 27.1 (2010): 48-58. Print.
Reynolds, Nedra. Geographies of Writing: Inhabiting Places and Encountering Difference. Carbondale: Southern Illinois UP, 2004. Print.
---. “Composition’s Imagined Geographies: The Politics of Space in the Frontier, City, and Cyberspace.” College Composition and Communication 50.1 (1998): 12-35. Print.
Rice, Jeff. Digital Detroit: Rhetoric and Space in the Age of the Network. Carbondale: Southern Illinois UP, 2012. Print.
---. “Urban Mappings: A Rhetoric of the Network.” Rhetoric Society Quarterly 38.2 (2008): 198-218. Print.
Schmidt, Christopher. “The New Media Writer as Cartographer.” Computers and Composition 28.4 (2011): 303-14. Print.
Selfe, Cynthia L. and Gail E. Hawisher. Literate Lives in the Information Age: Narratives of Literacy from the United States. Mahwah: Lawrence Erlbaum, 2004. Print.
Sorapure, Madeleine. “Information Visualization, Web 2.0, and the Teaching of Writing.” Computers and Composition 27.1 (2010): 59-70. Print.
Trainor, Jennifer. “Moving Beyond Place in Discussions of Literacy.” Literacy in Composition Studies 1.1 (2013): n. pag. Web. 3 January 2014.
Vie, Stephanie. “Digital Divide 2.0: ‘Generation M’ and Online Social Networking Sites in the Composition Classroom.” Computers and Composition 25.1 (2008): 9-23. Print.
The WIDE Research Center Collective. “Why Teach Digital Writing?” Kairos 10.1 (2005). Web. 7 September 2012.
Wysocki, Anne Frances, Johndan Johnson-Eilola, Cynthia L. Selfe, and Geoffrey Sirc. Writing New Media: Theory and Applications for Expanding the Teaching of Composition. Logan: Utah State UP, 2004. Print.